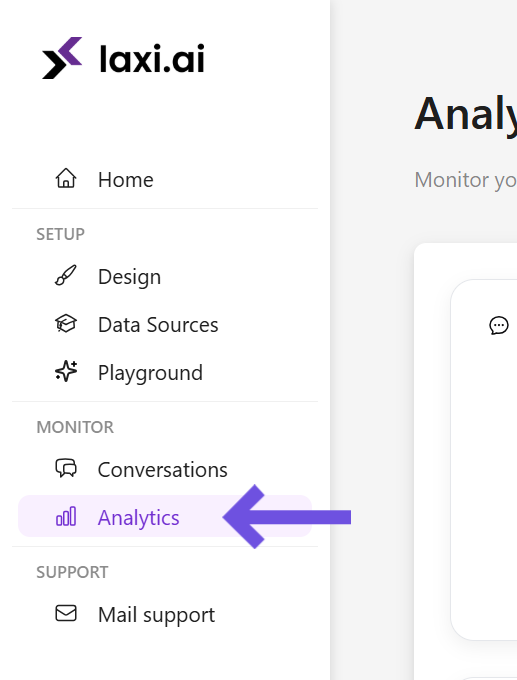
The Analytics Dashboard provides valuable insights into how your chatbot interacts with customers. It tracks engagement levels, message trends, and customer behavior, helping you refine chatbot responses and improve overall performance.To access the analytics, navigate to Laxi.ai Dashboard → Analytics.
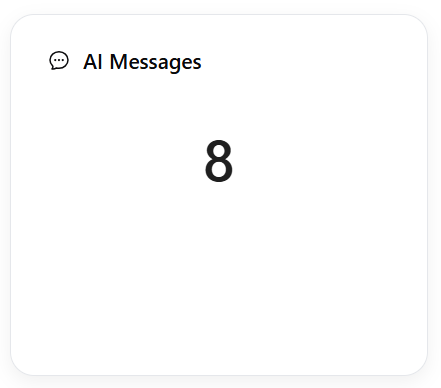
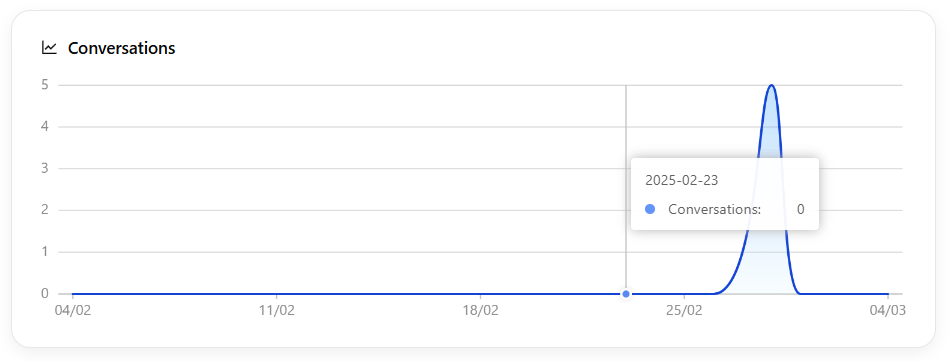
This section tracks how many messages the AI has sent in customer interactions. It provides a quick overview of the chatbot’s activity and helps measure overall engagement.A higher number of AI messages indicates frequent customer interactions. If you notice a sudden increase, it may suggest customers are asking more questions, and you may need to optimize responses.
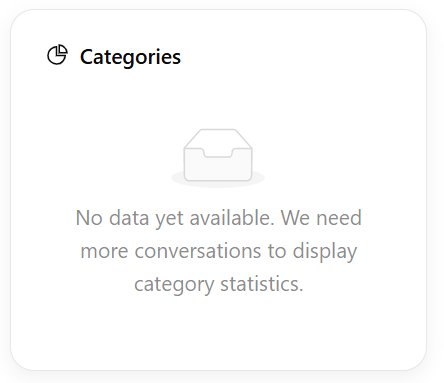
Messages handled by the chatbot are classified into different categories based on the type of customer query. This helps understand what users ask most frequently, allowing you to refine your chatbot’s responses.Some common categories include:
Product inquiries
Order tracking
Payment assistance
General store policies
By analyzing these categories, you can identify trends in customer needs and improve your knowledge base accordingly.
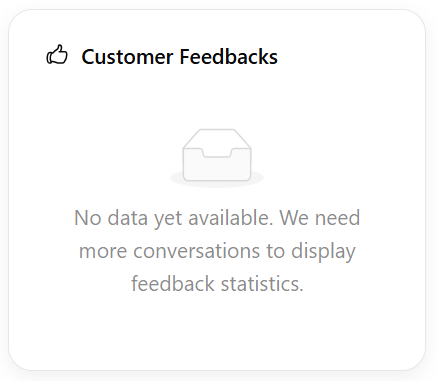
Laxi.ai allows customers to rate their chatbot experience by providing feedback after an interaction. This helps assess response quality and refine the chatbot’s performance.Monitoring customer feedback helps you:
Identify areas where the chatbot may need better responses
Improve user satisfaction based on feedback trends
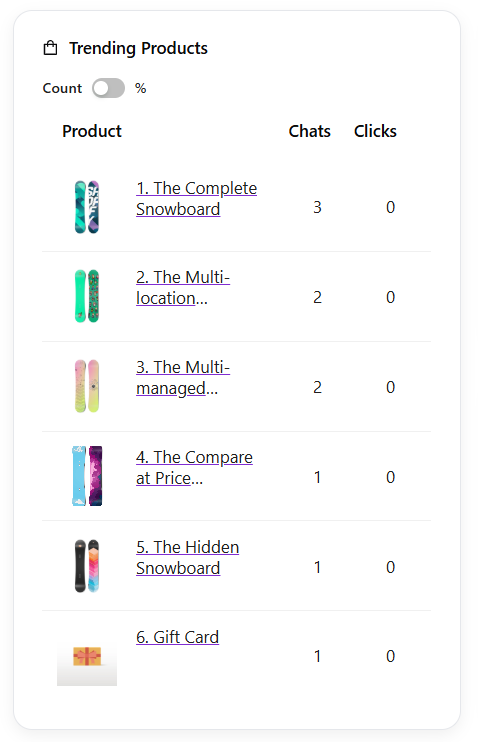
The Trending Products section shows which products are being browsed, recommended, or discovered through the AI agent. These trends help store owners identify popular products and potential bestsellers.If certain products appear frequently, it may indicate customer interest, suggesting they should be featured more prominently in your store or marketing campaigns.
The analytics dashboard provides powerful insights into chatbot interactions, customer preferences, and AI performance. By reviewing these metrics regularly, you can refine your chatbot responses, optimize product recommendations, and improve overall customer experience.For a deeper analysis, explore individual conversation history and detailed performance tracking sections in analytics.